Advanced Frontend Debugging
About me
- Member of the Firefox Developer Tools team
- Mainly working on the JS debugger and perf tools
- Worked with JavaScript, Java, C/C++, Perl and more in 15+ yrs (seen lots of tools)
Agenda
- The case for tools
- JavaScript Debugging
- Profiling
- Execution Tracing
- WebGL Debugging
- Debugging mobile apps
HTML5 & Tools
“I think the biggest mistake that we made, as a company, is betting too much on HTML5”
-- Mark Zuckerberg, Facebook CEO
“The biggest issue for HTML5 is the maturity of tools.”
-- Robert Shilston, FT Labs Director
The case for tools
- JS has been around forever
- People learned to code and debug using alert()
- With better tools we can create more robust and more complex programs
- A modern platform is not viable without great tool support
Inspection
JavaScript Debugging
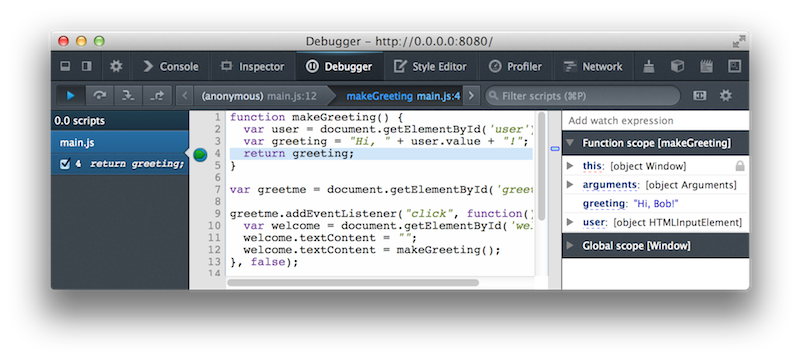
Inspecting State
- Call stack visualization
- foo > bar > baz
- Stack traces show the future, not the past
- Variable inspection
- Closure inspection
- Watch expressions
- Inspecting from the Console
Pausing Execution
- Breakpoints
- Conditional breakpoints
- Error breakpoints
- Event breakpoints
Working with frameworks
- Unminifying/pretty-printing
- Source maps (inspector, visualization)
- Black-boxing
Profiling
& Performance
CPU Profiling
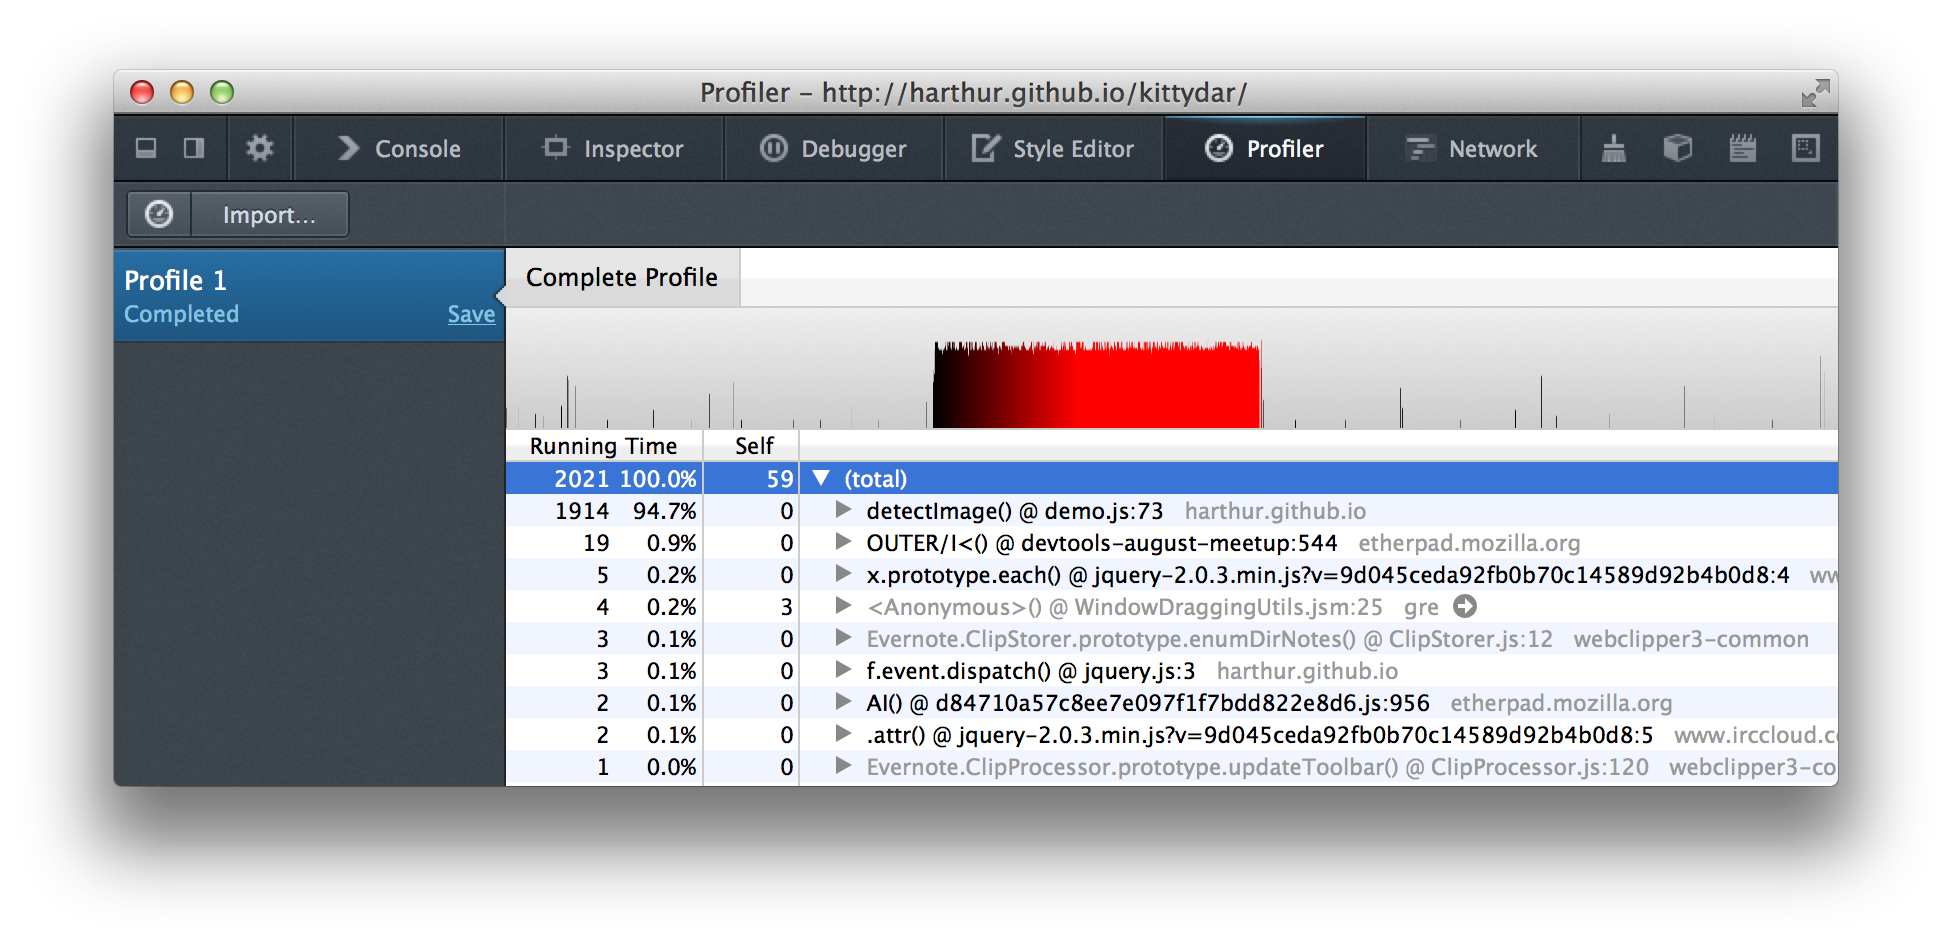
CPU Profiling (cont.)
- console.profile/profileEnd
- Concentrate on the hot spots
- Observe self time vs. other time
- Identify jank
- Enable platform profiling for further insights
CPU Profiling (cont.)
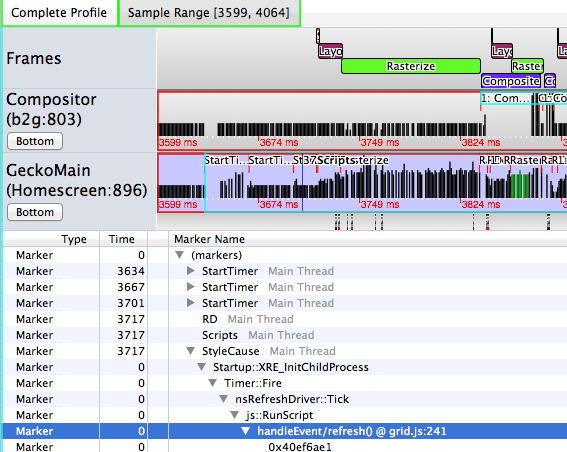
Exposing the rendering engine behavior
Minimizing engine work
Paintflashing
Avoiding reflows
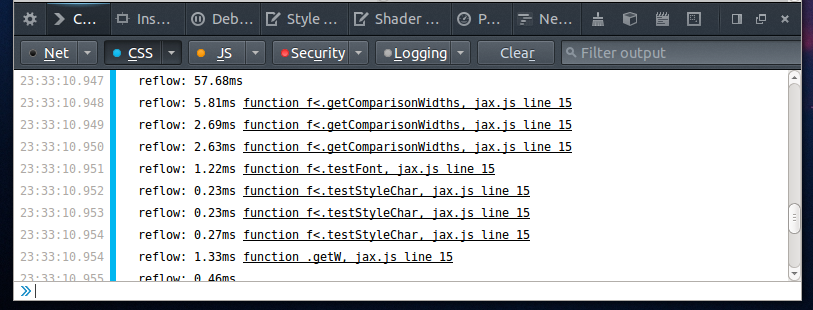
- Reflow events
- Frame rate visualization
- Set layers.acceleration.draw-fps: true
Minimizing engine work (cont.)
- Layer border painting
- Set layers.draw-borders: true
Optimizing JS objects
- Keep object shapes static
- delete obj.prop; // bad
- obj.prop = undefined; // good
- obj.prop = null; // good
- Cautiously consider Object.freeze
Memory Profiling
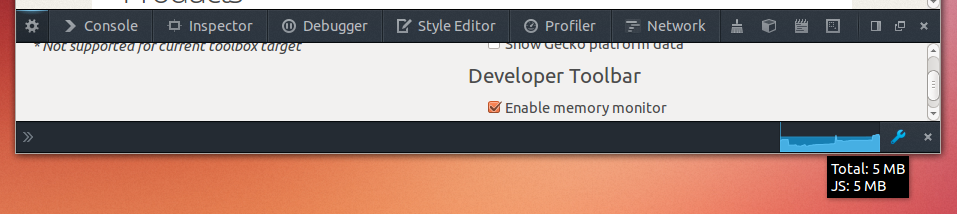
Memory monitor
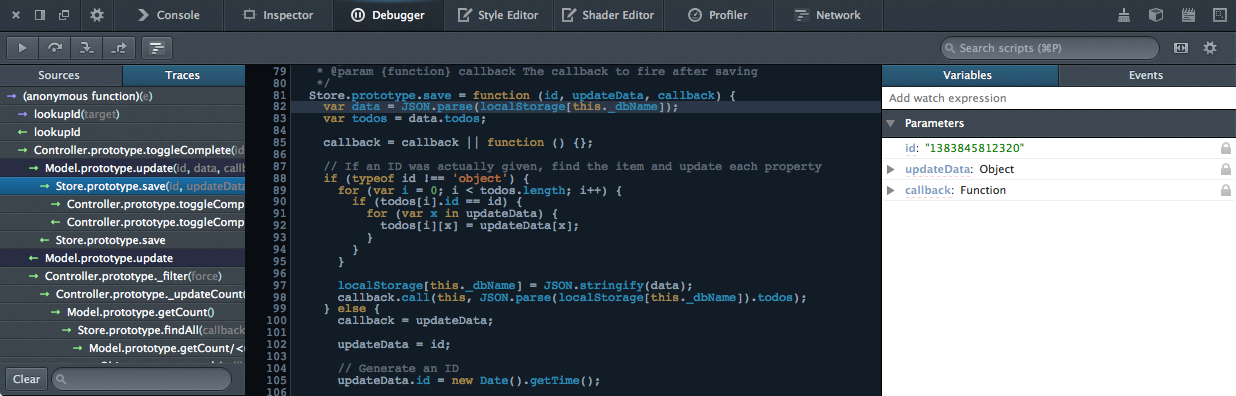
Tracing
Execution Tracing
- Tracing profiler or tracing debugger
- Observe runtime code paths
- Reason about program behavior
- Understand how 3rd-party code works
- Unsuitable for performance profiling due to overhead
Execution Tracing Implementations
Old-School Debugging
	0 (anonymous) foo.js:100
	1 (anonymous) foo.js:45
	2 (anonymous) bar.js:12
	3 (anonymous) baz.js:123
	4 main        baz.js:44
- "Always use named functions"
- "Some frameworks and tools understand fn.displayName"
Engines can infer function names
Anonymous functions no longer need to be named for debugging
	function f() {}          // display name: f (the given name)
	var g = function () {};  // display name: g
	o.p = function () {};    // display name: o.p
	var q = {
	  r: function () {}      // display name: q.r
	};
	function h() {
	  var i = function() {};    // display name: h/i
	  f(function () {});        // display name: h/<
	}
	var s = f(function () {});  // display name: s<
Modern Debugging
	0 f<          foo.js:100
	1 foo/<       foo.js:45
	2 bar/helper  bar.js:12
	3 bar.do      baz.js:123
	4 main        baz.js:44
- "Never use named functions"
- "Don't bother with fn.displayName"
WebGL
Debugging WebGL
WebGL demo
Mobile Apps
Responsive Design
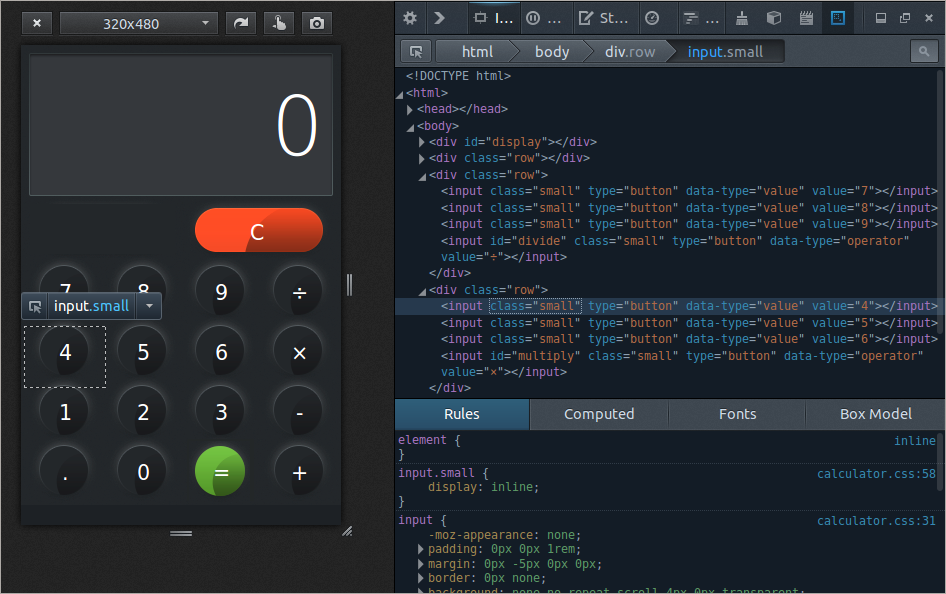
Test layout behavior in different screen sizes
Simulators
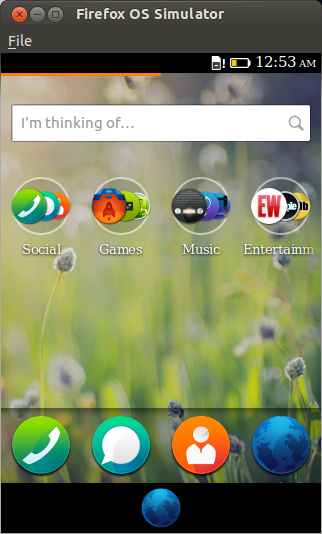
Debug issues related to APIs unavailable on desktop
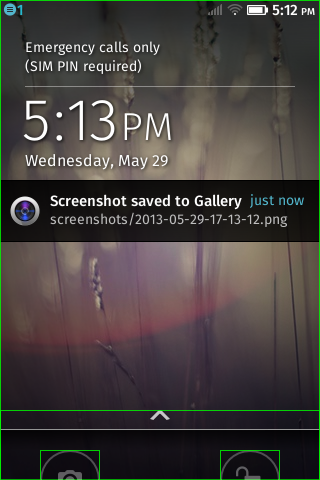
Remote debugging
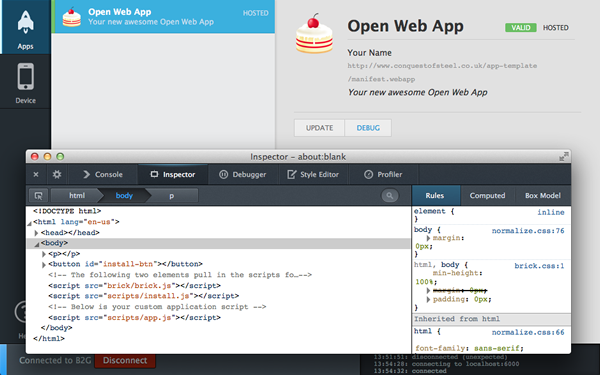
Diagnose problems that only manifest themselves in the real thing
Extending your tools

GCLI commands (docs)
	gcli.addCommand({
	  name: 'countdivs',
	  exec: function(args, context) {
	    return context.environment.document.querySelectorAll('div').length;
	  }
	});
Extending your tools (cont.)
In Conclusion
- What is already there:
- Tools for debugging JavaScript
- Profiling and performance tools
- Tools for working with WebGL
- Tools for debugging mobile apps
- What is coming:
- Execution tracing
- Memory profiling tools
- Much more!
Thank You
- Questions, feedback:
- Homework:
- Slides: astithas.com/talks/qconsf2013/
- Firefox Developer Tools: developer.mozilla.org/docs/Tools
- Get involved!